Executive Summary
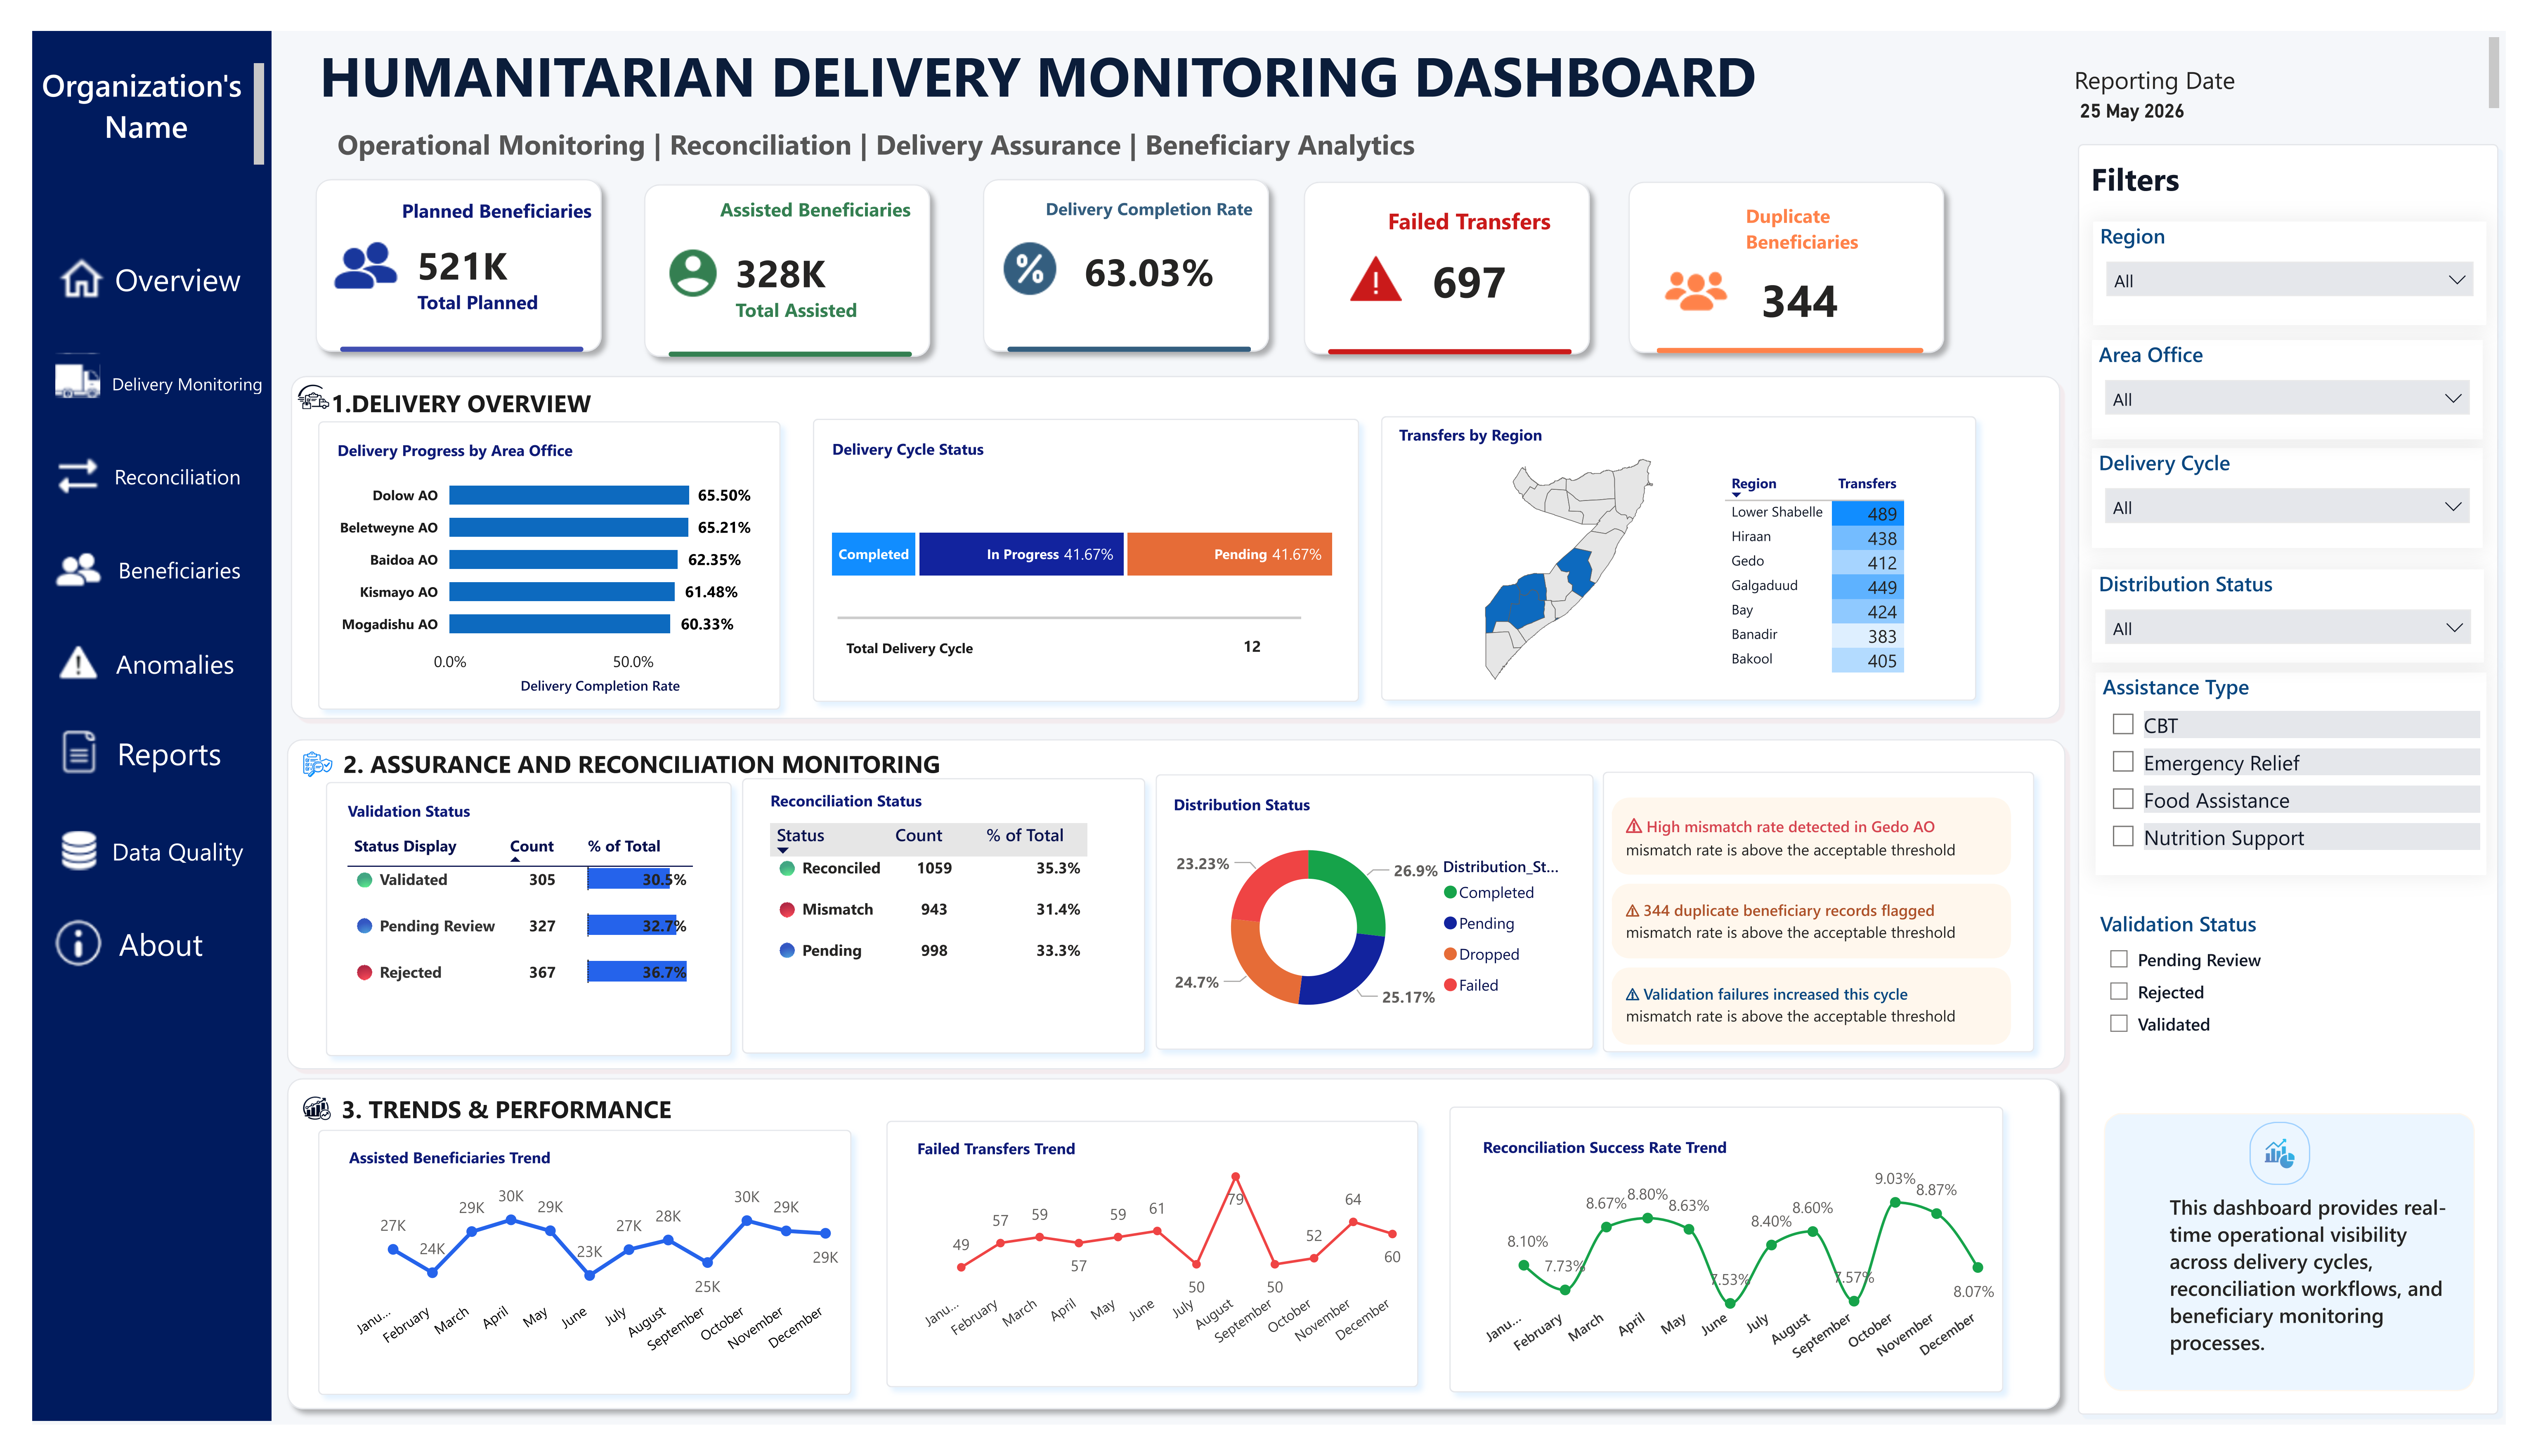
This Power BI solution demonstrates how humanitarian operations can be monitored through executive dashboards that consolidate delivery indicators into a single decision-support experience. The dashboard simulates operational reporting scenarios commonly encountered during assistance delivery cycles.
Business Challenge
Programme teams require timely visibility into delivery performance, transfer execution, and operational bottlenecks. Traditional reporting methods often provide fragmented information that delays decision-making and reduces operational awareness.
Analytical Approach
- Data preparation and transformation using Power Query
- KPI development using DAX calculations
- Executive dashboard design principles
- Operational storytelling through visualization
- Trend and comparative analysis
Dashboard Walkthrough
- Delivery Overview for monitoring assistance execution
- Regional comparisons to identify performance differences
- Reconciliation monitoring indicators
- Validation and assurance tracking
- Monthly trend analysis and executive KPIs
Key Insights Demonstrated
- Rapid identification of delivery bottlenecks
- Improved operational visibility
- Monitoring of transfer outcomes
- Performance tracking across reporting cycles
- Executive-level decision support
Technologies Used
Lessons Learned
Effective humanitarian reporting requires balancing technical sophistication with simplicity. Executive users benefit most from concise, actionable indicators presented through intuitive visual experiences.
Repository
Explore the complete portfolio repository, supporting documentation, and project assets on GitHub.
The analytical solution presented on this page was developed using synthetic datasets generated solely for demonstration purposes. The scenarios, indicators, and performance figures are fictional representations intended to showcase analytical methodologies, dashboard design techniques, and operational reporting capabilities. No real beneficiary records, programme data, confidential operational datasets, or organizational information have been used.